TL;DR: The Iran oil crisis is a supply shock, not a demand collapse. Energy producers, gold, short-duration bonds, and covered call sellers win in this environment. Airlines, BTC miners, and growth stocks get hurt. If a ceasefire drops oil 20-30%, the trade reverses — energy takes profits, airlines recover. Covered call income from elevated VIX is the most actionable move for income investors right now without changing long-term positioning.
I’ve been watching oil markets since 2014 when I started buying crypto. Every major oil spike I have seen created two groups of people: the ones who bought energy stocks at the top and spent years recovering, and the ones who understood the secondary effects and positioned accordingly. That second group did not always look smart immediately, but they ended up in better shape. Let me show you what I mean with the current situation.
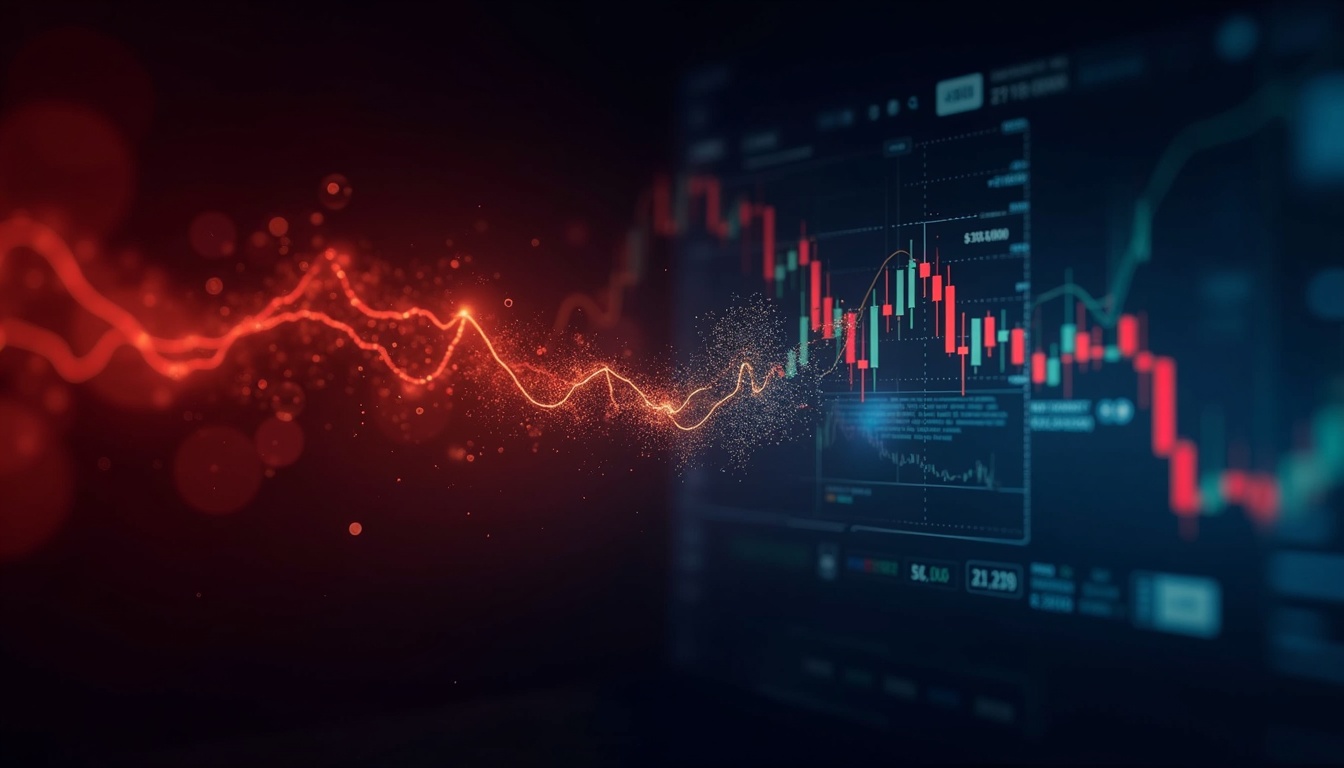
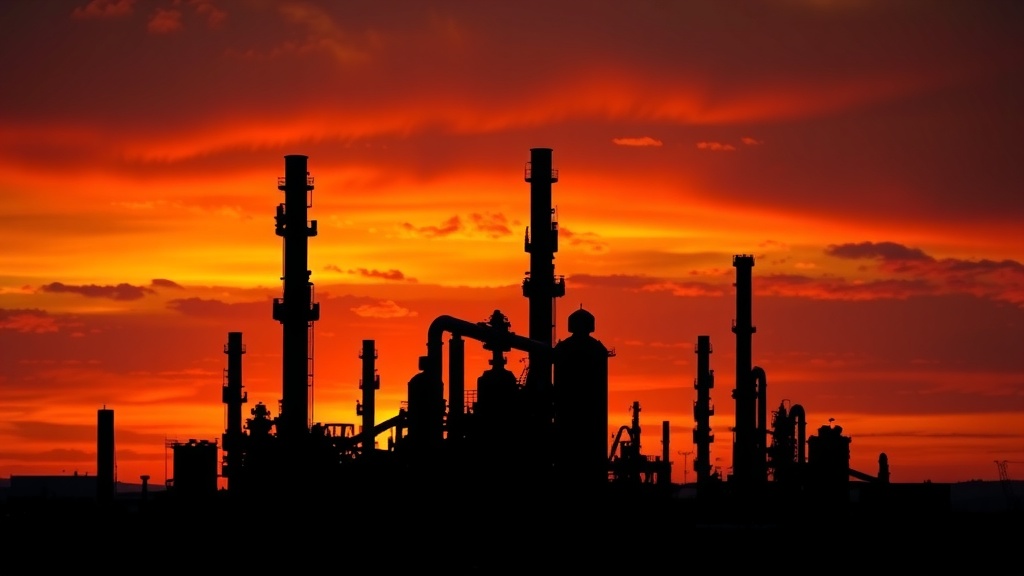
As of March 28, 2026, Brent crude is sitting around $108 per barrel. WTI is around $93. The Iran conflict began in early March when U.S. and Israeli strikes hit Iranian energy infrastructure. The Strait of Hormuz, which carries roughly 20% of the world’s oil supply, is partially blocked. Ships are still passing through but some are paying fees to the Iranian regime for approval and others are simply avoiding the route. Insurance costs for the ships that do go through have spiked significantly. Trump extended the ceasefire deadline by 10 days on March 28, with talks described as going well, but Iran is not confirming direct negotiations. That matters for the outlook in both directions.
Here is what I want to cover: what the historical oil crises actually teach us, who is positioned to benefit in this environment, who gets hurt, what the ceasefire scenario does to the trade, and where I have actually put my own portfolio.
Putting this into action: If you are repositioning your portfolio and want a platform with access to options, ETFs, and energy stocks without paying a subscription fee for tiered pricing, Robinhood Gold gives you a $5 monthly discount on a $500 minimum and includes Morningstar research, IPO Access, and better interest on uninvested cash. It is where I manage the options portion of my yield portfolio.
What is actually happening right now
The short version is that a shooting war in the world’s most strategically important oil region is creating a supply shock at the same time that global trade policy is already creating uncertainty. These two things are compounding each other, but they are not the same thing. Separating them matters for understanding the scenarios ahead.
On the Iran conflict: the strikes on Iranian energy infrastructure in early March 2026 were the opening move. The Strait of Hormuz partial disruption came as a secondary effect. Oil spiked above $80 on the initial news and has remained well above $100 since. The Trump administration extended a ceasefire deadline by 10 days as of March 28, which is a signal that diplomacy is active but not yet resolved. The market is pricing a moderate ceasefire probability, which is why oil has not hit $120 but also has not retreated back to the $75 range.
On the tariff side: the tariff policy uncertainty is creating a separate drag on business investment and consumer spending. The Fed is caught in the middle. It cannot cut rates to stimulate the economy because oil-driven inflation is still elevated. It cannot hike rates because the jobs data is deteriorating. That policy trap is contributing to the equity market weakness independently of the oil shock. My market volatility article from this week covers the tariff and macro picture in more detail.
The key thing to watch: Turkey swapped 60 tons of gold, worth roughly $8 billion, in a two-week period. Headlines called this an “abandonment of gold.” That is wrong. Turkey needed FX liquidity, not a change in its view of gold as a reserve asset. Goldman Sachs estimates the recession probability at 30% over the next 12 months — elevated but not base-case. Gold itself has held up well throughout this period. The swap was about solving a short-term balance of payments problem, not a macro thesis change. When you see gold being used as liquidity rather than hoarded as a static holding, that is actually a signal of stress in the conventional financial system, not a vote of no confidence in gold.
The historical parallels: 1973, 1979, and what is different today
The 1973 Arab oil embargo is the most commonly cited parallel. OPEC restricted oil exports to the United States and several other countries. Oil prices quadrupled. The S&P 500 fell roughly 48% from peak to trough. Inflation peaked at 12.3% by 1974. The recovery took years.
The parallel to today is real in one specific sense: a supply shock causing inflation at the same time that economic activity slows. That is the definition of stagflation and it is what markets are beginning to price right now. The difference is the mechanism. In 1973, the shock was a coordinated cartel action by sovereign nations. Today it is a geopolitical war that is disrupting a critical shipping chokepoint. The U.S. is now a net energy exporter, which partially insulates domestic consumers from the full global price effect. And the Hormuz disruption, while serious, is not a complete blockade. Some oil is still flowing. That matters for the severity.
The 1979 Iran-Iraq war is a closer parallel in some ways. Iran was again the epicenter. Oil markets were disrupted for an extended period. The S&P was essentially flat to negative in real terms for years as stagflation took hold. Energy stocks, however, were a bright spot. If you owned Exxon, Chevron, or the energy sector ETFs of the day, you did relatively well while the broader market struggled. The 2022 Ukraine conflict followed a similar pattern. Brent hit $130 on the Russian invasion and energy stocks surged. The energy sector of the S&P was up over 50% in 2022 while the S&P as a whole was down about 18%.
The lesson from both historical episodes is consistent: energy sector positions held up well during oil shocks while the broader market sold off. But timing matters enormously. Buying energy stocks after the initial spike already happened in 1979 or 2022 meant buying at elevated valuations right before the situation resolved. The people who benefited most were the ones who had energy exposure before the shock hit.
Who wins in an extended oil crisis
The obvious winners are energy producers. Exxon (XOM) and Chevron (CVX) are up meaningfully in 2026 as of late March. The energy sector broadly has outperformed the S&P and Nasdaq significantly. If you own energy sector ETFs like XLE or VDE, they are performing a different function in your portfolio right now than the Nasdaq-heavy growth positions.
Gold is a more nuanced win. Gold held up well as an inflation hedge and safe-haven asset, but it did not surge the way some people expected. Part of that is because the conventional financial system is showing signs of stress in other ways, which Turkey’s gold swap illustrates. When gold is being used for FX liquidity rather than hoarded as a static holding, that tells you something about where institutional preference is going. I hold Bitcoin as my primary alternative reserve asset and gold does not change my view on that, but if you are in the goldETF space, the current environment is not hostile to it.
Short-duration bonds are a win because when the Fed is stuck and cannot cut, bonds with shorter duration have less interest rate risk than long-duration bonds. Investment-grade corporate bonds are getting recommended by some fund managers as a stagflation hedge. That is not a thrilling return profile, but it is better than holding long-duration Treasuries in an environment where rate uncertainty is high.
Covered calls on existing positions are winning because high VIX means elevated option premiums. My YieldMax positions are writing options with meaningfully higher premiums than they were six weeks ago. That income does not depend on the market going up. It depends on the market moving around, which it definitely is right now. My covered calls breakdown goes into the mechanics of why this works in volatile markets.
Who gets hurt
Airlines are getting squeezed hard. Fuel costs are a massive input cost for airline companies. When oil is above $100, margins compress immediately. The Nasdaq is down partly because tech valuations were already pricing a benign rate environment that is no longer assured. Airlines are down for more direct, fundamental reasons tied to input costs.
Shipping companies that cannot pass through fuel costs are also under pressure. The ones with older, less fuel-efficient fleets are getting hit harder than those with newer vessels that have better consumption profiles. This is a real economic effect and it is showing up in shipping equity prices.
Bitcoin miners are an interesting case that does not get enough attention. Mining Bitcoin is electricity intensive. High oil prices mean high electricity costs in many regions, especially for miners using fossil fuel-based grid power. That compresses margins for miners who are not in cheap energy regions. Some publicly traded miners have highlighted this in their recent earnings calls. The BTC price is down alongside equities in this environment, so miners are getting squeezed on both the revenue side and the cost side simultaneously. That is a different picture than 2021 when BTC miners were printing money even as energy costs rose.
Growth stocks broadly are getting hurt because the rate path has become uncertain. High oil means inflation. Inflation means the Fed cannot cut. No Fed cuts means growth stock valuations, which are worth something based on future earnings discounted to present value, become worth less when that discount rate is going up or staying elevated. That is a mechanical relationship and it is playing out the way theory predicts.
The ceasefire scenario: what a swift resolution does to the trade
Here is the asymmetric bet that I think is worth understanding. Right now the market is pricing a moderate probability of an Iran ceasefire. Trump extended the deadline by 10 days. The talks are described as going reasonably. If a ceasefire is reached and Hormuz shipping normalizes, oil drops 20% to 30% within days. That is a reasonable expectation based on how fast the supply disruption happened.
Who benefits most from that scenario? Airlines, shipping companies, and consumer discretionary stocks that would see input cost relief. Energy longs, which have been the safe harbor in 2026, would give back some of their gains. The trade that has been working, owning energy stocks and shorting the rest, reverses partially.
Who benefits least? Energy producers who have already run up on the crisis premium. If you bought XLE in the first week of March, you are sitting on gains that partly reflect the oil spike. A ceasefire would give some of that back.
The honest risk is that the ceasefire scenario does not play out cleanly. The extension of the deadline by 10 days could lead to a longer impasse, or Iran could reject the terms and the conflict continues. If that happens, oil stays elevated and the sectors that are winning continue to win. The “obvious trade” of buying energy stocks is obvious precisely because the scenario is already happening. The harder question is what happens when it stops happening.
My take: I do not have the intelligence to predict the ceasefire outcome. What I do have is a framework for what to do in either scenario. If ceasefire: take some profit on energy longs and look at airline and shipping recovery positions. If extended conflict: hold energy exposure and keep writing covered calls for the premium income. The covered call income does not disappear if the energy trade stops working. It just comes from a different set of positions.
My actual positioning
Here is what I changed and what I did not touch this week. I did not sell my Bitcoin. I did not sell my YieldMax positions. I did not go to cash. Those decisions were made based on my long-term plan and the current volatility does not change that plan.
What I did do: I reviewed my energy exposure within my ETF portfolio. I have XLE as part of my sector allocation and it has performed well in 2026. I am not adding to it at current valuations because the easy move has already happened. The energy thesis was right six weeks ago at lower prices. It is still directionally correct, but the risk-reward at $108 oil is different than at $85 oil.
I am also looking at a small allocation to investment-grade corporate bonds as a stagflation hedge within my fixed income sleeve. That is not exciting. It is also not a loss of principal at current yields if the economy does not fall into a hard recession.
The covered call income from my YieldMax positions is the most quietly productive part of my portfolio right now. VIX is elevated and my option sellers are collecting meaningful premiums. That income is real and it does not require me to predict whether the Nasdaq hits a new low or bounces next week. If you want to understand the mechanics of that strategy in more depth, my cash-secured puts guide covers the related option strategy angle.
FAQ
Is this the 1970s oil crisis happening again?
Similar in mechanism but different in structure. The 1973 and 1979 crises involved sovereign cartel coordination and lasted years. Today the disruption is a geopolitical conflict affecting a critical shipping chokepoint. The U.S. is a net energy exporter now, which partially insulates domestic consumers. And the Hormuz disruption, while serious, has not been a complete blockade. The secondary effects on inflation and growth are real, but the historical parallel is not exact.
Should I buy energy stocks now or is it too late?
It depends on your time horizon and how you define “energy stocks.” If you are buying individual producers like XOM or CVX as a long-term position, the case is different than buying sector ETFs after a 15% to 20% run in six weeks. The easy thesis has largely played out at current oil prices. The question is whether oil stays at $100-plus for years or normalizes. That answer is not clear.
What does high oil mean for Bitcoin and crypto?
High oil creates inflation and economic uncertainty. Historically that has been mixed for risk assets including crypto. Bitcoin has not yet proven to be the inflation hedge it was marketed as during the 2020-2021 bull market. In the current drawdown, BTC is down alongside equities. The energy cost pressure on BTC miners is an additional headwind. That does not change my long-term view on BTC, but it is a real factor in the near term.
Are dividend stocks a safe play during an oil crisis?
Dividend stocks are not a monolithic category. Energy dividend stocks are winning because the sector is profitable. Consumer staples dividend stocks are mixed because input costs are rising. SCHD and broad dividend ETFs have actually held up better than growth in 2026, which reflects the rotation from growth to value that high inflation and rate uncertainty typically trigger. That does not make them universally safe, but it makes them less exposed to the specific dynamics hurting growth stocks right now.
What is the best defensive portfolio positioning if oil stays high?
Short-duration investment-grade bonds, energy sector exposure, and covered calls on existing equity positions are the three most commonly recommended plays in a stagflation environment. Cash is underrated in a volatile market. The mistake most people make is either staying 100% in risk assets because “it will recover” or going 100% to cash because “it is too uncertain.” A blended approach adjusted for your actual time horizon is almost always more defensible than either extreme.